AAPL

Apple Overview
AAPL Apple an set all-time closing high on Wednesday, December 22 of $325.16 and then closed just below for the week. Apple was up for the week to close at $323.60 on Thursday, December 23, 2010. AAPL was up +0.93% for the week, is up +4.00% for December, is up an incredible +53.56% for the year, and is up an astronomical +289.36% since the March 9, 2009 market bottom. This equates to +$2.99 for the week, +$12.45 for December, +$112.87 for the year, and +$240.49 since the March 9, 2009 market bottom. AAPL is down -0.48% and -$1.56 from the 2010 YTD and all-time closing high of $325.16 on Wednesday, December 22. Apple has closed above $300 for 51 consecutive trading days and above $320 for 12 of the past 14 trading days. AAPL finished November up +3.38%, after gains in October +6.07% and September +16.72%.
S&P 500 By comparison, the overall market, the S&P 500, was up +1.03% for the week, is up +6.46% for December, is up +12.70% for the year, and is up +85.77% since the March 9, 2009 market bottom. SPX closed at a YTD and multi-year closing high of 1258.84 on Wednesday, December 22, 2010, the highest close since the September 8, 2008 close of 1267.79. AAPL is outperforming the overall market long-term since the March 9, 2009 market bottom, outperforming the market for 2010, outperformed the market in September, October, and November, but continues to lag in December. A review of the S&P 500 is here [S&P 500 at Lofty Heights (Charts) *Climbing the wall of worry*].
Apple News and Fundamentals Apple reported record revenues and net income for Q3 2010, which are reviewed and analyzed on this blog.. Q4 2010 is expected to be even better. Current Apple financial data, charts, and review is at the Apple Financial Performance page, updated for the latest calendar Q3 results reported on October 18. A review and analysis of the most recent Q3 earnings call has been posted at the Apple Earnings Conference Call page. Our valuation and target price of AAPL stock is posted at the Apple Stock Valuation page. On December 21 Apple reported sales of Apple TV would surpass 1 million units during the week. On Wednesday, October 20, the all-new MacBook Air was unveiled along with updates for the iLife suite, FaceTime for Mac, and a peak at the next OSX upgrade, Lion. Apple launched in September both the iPad and iPhone 4 in China, the world's largest Internet market with a growing consumer base with disposable income. On September 1 with the Apple Special Music Event, CEO Steve Jobs launched new iPods, iTunes, iOS, and Apple TV. A summary and review of these announcements is posted here (Steve Jobs Unveils New iPods, iOS, iTunes, TV) and here (Apple Announces New iPods, iTunes, iOS, TV). Earlier, Apple launched the iPhone 4 in late June and the iPad in early April. International sales accounted for 52% of revenue in the latest quarter reported.
Apple News and Fundamentals Apple reported record revenues and net income for Q3 2010, which are reviewed and analyzed on this blog.. Q4 2010 is expected to be even better. Current Apple financial data, charts, and review is at the Apple Financial Performance page, updated for the latest calendar Q3 results reported on October 18. A review and analysis of the most recent Q3 earnings call has been posted at the Apple Earnings Conference Call page. Our valuation and target price of AAPL stock is posted at the Apple Stock Valuation page. On December 21 Apple reported sales of Apple TV would surpass 1 million units during the week. On Wednesday, October 20, the all-new MacBook Air was unveiled along with updates for the iLife suite, FaceTime for Mac, and a peak at the next OSX upgrade, Lion. Apple launched in September both the iPad and iPhone 4 in China, the world's largest Internet market with a growing consumer base with disposable income. On September 1 with the Apple Special Music Event, CEO Steve Jobs launched new iPods, iTunes, iOS, and Apple TV. A summary and review of these announcements is posted here (Steve Jobs Unveils New iPods, iOS, iTunes, TV) and here (Apple Announces New iPods, iTunes, iOS, TV). Earlier, Apple launched the iPhone 4 in late June and the iPad in early April. International sales accounted for 52% of revenue in the latest quarter reported.
Economic and Market News Information about the USA and world economies plus the USA financial system are posted at Boom Doom Economy and Financial Controls.
Apple Has Another All-Time Week, Continues Above $320
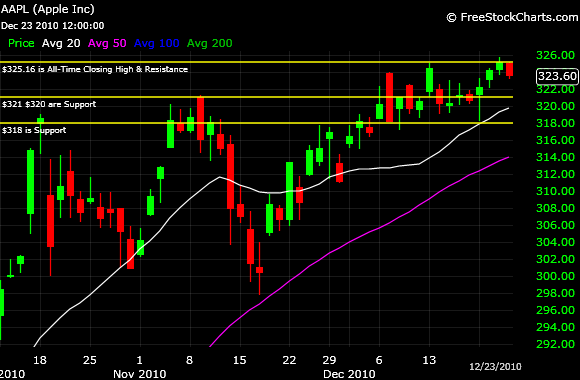
AAPL Daily Chart Below is the AAPL daily chart since October 13, 2010 (Apple reported calendar Q3 financial results on October 18) to illustrate just the applicable price interactions with the current close, resistance, and support. There are no previous price interactions, Apple has never traded this high before, above $300 and now $320. A monthly chart is included at the bottom of this page for a broader perspective.
Noteworthy Closing Prices on Daily Chart Below
Current Close: $323.60
2010 YTD and All-Time High, December 22: $325.16
2010 YTD Low, February 4: $192.05
YE December 31, 2009: $210.73
* The 100 and 200 day simple moving averages and the uptrend line are not shown on the daily chart this week *

Intermediate-Term Trend The intermediate-term signal, the comparison of the 25 day and 50 day simple moving averages, generated a buy signal on Tuesday, September 21. That is, the 25d sma is greater than the 50d sma. The relationship between these two moving averages is a lagging indicator. The 25d sma (not shown on chart) is sharply ascending and the 50d sma continues ascending.
Resistance The all-time closing high of 325.16 on December 22 (highest yellow horizontal line on the daily chart above) and the related intraday high of 325.72 that same day are current resistance.
Support AAPL surpassed 300.00 for the first time in history on October 13 and now has remained above 300.00 for 51 consecutive trading days, so there are multiple levels of support below. The 321 and 320 area (middle yellow horizontal line on the daily chart above) is first support, including the 20 day simple moving average of 319.70. This corresponds with multiple closings in this area. Next support is the 318.00 area (lowest yellow horizontal line on the daily chart above). This corresponds with October 18, November 10, and December 2 closings of 318.00, 318.03, and 318.15, respectively. Even the 50 day simple moving average is in play as support at 313.95. Additional support is below, all the way to the benchmark and psychological 300.00 area. Support was found at 300.00 on October 13, 14, 19, 28, 29 and November 16, 17 to continue above 300.00.
Moving Averages AAPL is above all the simple moving averages monitored: the 20, 25, 50, 100, and 200 day (only the 20d and 50d sma's are shown on the daily chart above). All are ascending. Each is above any longer term average. These moving averages are spread out in a bullish fan.
Uptrend Line (not shown on chart) The yellow uptrend line, a rate of price ascent, is from the January 20, 2009 cyclical closing low of 78.20 up through the February 4, 2010 YTD closing low of 192.05. The January 20 closing low has been the bottom for 2010. AAPL dropped below this trendline on August 23, but regained it on September 3 and now has been above since.
Downtrend Line AAPL is just below the recent all-time closing high of 321.67 on December 13 and there is no significant downtrend line in play.
Relative Strength Index (RSI) The RSI 14 day = 65.63 is reasonable. descending, below the recent highs, and has only reached recent highs in the low to mid 70s due to the gradual gains. The multi-year and 2010 high was 97.49 on September 16. The 2010 YTD low was 21.49 on August 24. The RSI 28 day = 61.17 is reasonable, descending, and well below the recent highs. The 2010 peaks have been 84.63 and 83.79 on April 5 and April 23, respectively. The 2010 low was 38.25 on August 31. Both RSIs continue reasonable, with upside room, due to the recent narrow trading range and gradual gains.
MACD (12,26,9) The MACD = 0.00, is level, trendless, and reflects both the narrow trading range and gradual gains. The September 22 MACD of +3.16 is the 2010 YTD high. The 2010 low was -3.55 on May 7. Previously the highest was on November 4, 2008 at +3.41.
Volume Volume was a low 8.0M on Thursday, December 24, due to the Holidays, and appears to be a multi year low. This is below the the descending 20 day moving average of approximately 12.9M. The 20d sma peaked right after the calendar Q3 earnings report on October 18 and is at a multi-year low. The 50d sma is approximately 16.4M, descending, and the lowest since October 2009.
Long-Term Trend The 10 month exponential moving average of 272.93 is a long-term trend indicator and shown on the monthly chart below. That is the line in the sand, so to speak, for the long term signal of a bear market. AAPL is well above this signal at the current close. AAPL is in a long-term bull market and has been since April 2009.
Conclusion AAPL continues above 320.00 on declining volume, which does not appear to be a reason for concern. Calendar Q4 financial results are expected to be more all-time record revenues and earnings. Presently AAPL has rallied above the 318.00 benchmark price. More about AAPL stock evaluation in future posts, but the current AAPL price appears low. Our price target for AAPL is $400. The intermediate-term trend continues bullish and the long-term trend continues bullish.
AAPL Monthly Chart
Up +314% and +$245 from January 20, 2009 cyclical closing low of $78.20!
Below is the monthly AAPL chart since the January 2009 cyclical low. The overall analysis and commentary is the same as for the daily chart above. The current price is the yellow horizontal line. The yellow uptrend line is the same as described, but not shown, on the daily chart above. The white moving average line is the 10 month exponential moving average of 272.93, which is the long-term bull or bear market signal. AAPL is well above the 10m ema with the current close. AAPL has remained above the 10m ema since April 2009 indicating a long-term bull market.


Disclosure
We are long AAPL.
About Apple
Apple Inc. achieved a milestone the week of May 24, 2010, passing Microsoft in market capitalization to become the largest technology company, and second overall largest company, in the USA. AAPL's market capitalization is now $296.84B, compared to Microsoft's of $242.12B. Exxon leads with $369.12B. Apple reported calendar Q3 revenues of $20.3B and net income of $4.3B. Microsoft reported calendar Q3 revenues of $16.2B and net income of $5.4B. Current Apple financial data is at the Apple Financial Performance page. Current Microsoft financial data is at the Microsoft Financial Performance page. Apple is now 20.02% of the NASDAQ 100 index, as measured by the QQQQ ETF portfolio holdings, weighted by market capitalization. AAPL is one of the most traded stocks in the USA. Per the SEC Form 10-K, Apple had 46,600 full-time employees and 2,800 temporary full-time employees and contractors as of September 25, 2010.
Apple's Mission Statement and as described in press releases, "Apple designs Macs, the best personal computers in the world, along with OS X, iLife, iWork, and professional software. Apple leads the digital music revolution with its iPods and iTunes online store. Apple reinvented the mobile phone with its revolutionary iPhone and App Store, and has recently introduced its magical iPad which is defining the future of mobile media and computing devices."
More Charts and Analysis!
Apple (AAPL) financial performance and stock charts
Google (GOOG) financial performance and stock charts
Microsoft (MSFT) financial performance charts
Intel (INTC) financial performance charts
VMware (VMW) financial performance charts
SalesForce.com (CRM) financial performance charts
USA failed and problem banks
Federal Reserve statistical releases
JPMorgan Chase & Co. (JPM) financial performance charts
Citigroup (C) financial performance charts
Goldman Sachs (GS) financial performance charts
Wells Fargo (WFC) financial performance charts
Bank of America (BAC) financial performance charts
Morgan Stanley (MS) financial performance charts


AAPL


